The emissions of greenhouse gases (GHG) are produced by Iren Group directly in the production processes (scope 1) and indirectly both through the possible supply of electricity from third-parties (scope 2) and along the value chain (scope 3).
In this report they are considered and counted as CO2 equivalent emissions:
- scope 1: all direct emissions produced by sources owned by the Group, i.e. the CO2 emissions generated by the combustion of fuels and waste for the production of energy and heat, those originating from the fleet of company vehicles, fugitive methane emissions from gas distribution networks and landfills, those related to fluorinated gases and those deriving from the consumption of fuels for heating the buildings of the various offices and for other activities to support production;
- scope 2: CO2emissions deriving from the Group’s indirect consumption, i.e. the emissions generated by electricity purchased from third-party suppliers and consumed both in the Group’s plants and offices;
- scope 3: all emissions which, although connected to core and business activities, are not directly controlled by the Group but are produced in Iren’s value chain, both upstream and downstream.
In 2021, a further timely and in-depth review of the GHG emissions inventory was carried out in order to consolidate the mapping of the Group’s emission sources, also with the aim of submitting emission reduction targets to Science Based Target Initiative (SBTi) validation. By virtue of this revision, the following have been incorporated into the inventory:
- la riduzione dell’intensità carbonica della produzione energetica (scope 1);
- l’azzeramento delle emissioni di scope 2, calcolate secondo la metodologia market-based del GHG Protocol, che tiene conto della tipologia di energia elettrica acquistata dal Gruppo (es. certificata da fonti rinnovabili mediante Garanzia di Origine);
- la riduzione delle emissioni di scope 3 relative all’utilizzo dei prodotti venduti (categoria 11 del GHG Protocol) e delle emissioni di scope 3 correlate all’acquisto di energia (categoria 3 del GHG Protocol).

The decarbonization strategy adopted by the Group has led to the definition, in the Strategic Plan to 2030, of significant targets for the reduction of GHG emissions that affect production processes, procurement and commercial policies:
- the reduction of the carbon intensity of energy production (scope 1);
- the zeroing of scope 2 emissions, calculated according to the market-based method of the GHG Protocol, which takes into account the type of electricity purchased by the Group (e.g. certified from renewable sources through Guarantee of Origin);
- the reduction of scope 3 emissions related to the use of products sold (category 11 of the GHG Protocol) and scope 3 emissions related to energy purchases (category 3 of the GHG Protocol).
| Scope 1 emissions | |||
|---|---|---|---|
| Direct GHG emissions - Scope 1(tCO2eq) | 2021 | 2020 | 2019 |
|
Production plants1 |
3,764,218 |
3,856,284 |
3,917,267 |
|
of which cogeneration, thermal and thermoelectric power plants |
3,333,617 |
3,418,020 |
3,484,516 |
|
of which waste-to-energy plants (non-biogenic portion) |
430,573 |
438,232 |
432,720 |
|
of which combustion reactions for process uses or services |
28 |
32 |
31 |
|
Company vehicles2, 3 |
19,978 |
18,555 |
20,517 |
|
Gas distribution network4 |
22,699 |
21,039 |
161,367 |
|
Landfills5 |
163,106 |
166,025 |
7,134 |
|
Altre emissioni (riscaldamento, condizionamento e altre attività a supporto della produzione)2, 6, 7, 8 |
8,361 |
7,126 |
7,134 |
| Totale | 3,978,362 | 4,069,029 | 4,127,723 |
1 The fuel emission coefficients published in the 2021 National Standard Parameter Table of the Ministry of the Environment and the Protection of the Land and Sea were used.
2 The data for 2020 has been restated.
3 INEMAR - ARPA Lombardia (2018) emission coefficients were used.
4 A gas leakage rate value of 0.1% and methane GWP of 28 were assumed.
5 Methane GWP of 28 was used.
6 The data for 2019 has been restated.
7 Fuel emission coefficients published in the 2021 National Standard Parameters Table and specific GWPs for individual fluorinated gases were used.
8 Emissions of ozone-depleting substances, expressed as tCO2eq, are included.
| Direct biogenic CO2 emissions (tCO2eq) | 2021 | 2020 | 2019 |
|---|---|---|---|
|
Waste-to-energy plants |
448,147 |
456,119 |
450,383 |
|
Landfills and wastewater treatment plants |
32,796 |
24,915 |
21,444 |
| Total | 480,943 | 481,034 | 471,827 |
Power generation carbon intensity stands at 323 gCO2eq/kWh in 2021 (the index is calculated according to the methods provided by SBTi considering all scope 1 emissions from energy production plants, related to the total electricity and heat produced), an improvement of 3% compared to 2020, mainly due to lower thermoelectric production, which had recorded an exceptional increase in 2020, and the increase in energy generated by cogeneration plants and waste-to-energy plants.
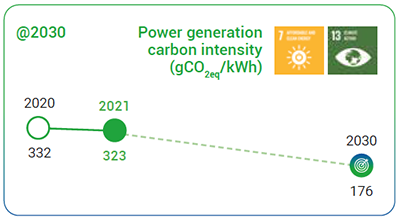
The objective set out in the Group’s Business Plan is to reduce the power generation carbon intensity to 176 gCO2eq/kWh in 2030. The path, defined for the achievement of this objective, includes several variables: industrial, such as the development or acquisition of renewable sources for energy production, of scenario, such as the availability of hydrogen and renewable gases that allow the use of fuel blends to replace natural gas alone, and technological, such as the capture and storage of CO2 emitted by plants.
| Scope 2 emissions | |||
|---|---|---|---|
| GHG emissions - Scope 2(tCO2eq) | 2021 | 2020 | 2019 |
|
Location-based methodology1 |
111,869 |
99,720 |
105,583 |
|
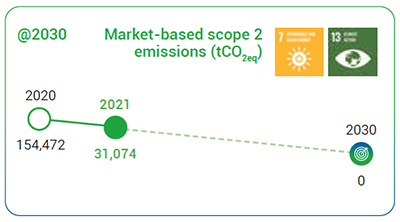
Market-based methodology2 |
31,074 |
154,472 |
155,664 |
1 The location-based methodology considers the average emission intensity of the networks where energy consumption occurs (using primarily network average emission factor data). Emissions are therefore obtained by multiplying the electricity purchased from thirdparties by the emission factor of the national electricity mix, which for 2021 is equal to 278 kgCO2/MWh, for 2020 it is equal to 296 kgCO2/ MWh and for 2019 is 316 kgCO2/MWh (Source: Italian National Inventory Report 2021, ISPRA). This factor accounts for the mix of various production sources for the purchased electricity.
2 The market-based methodology considers the emissions of the type of electricity the company has chosen to purchase. The emissions are, therefore, obtained by setting at zero emissions the share of purchased electricity from renewable sources certified by Guarantee of Origin and multiplying the share of purchased electricity from non-renewable sources by the emission factor that refers to the national residual mix, which for 2021 is considered to be equal to the value for 2020 (pending publication of the updated value) i.e. 458.57 kgCO2/MWh, and for 2019 is 465.89 kgCO2/MWh (Source: European Residual Mixes, AIB). This factor considers the residual mix of the various sources of production of the purchased electricity, net of the portion certified by the Guarantee of Origin.
Compared to the prior year, 2021 shows a 12% increase in scope 2 location-based emissions related to the increase in purchased electricity by the Group under the scope expansion. The strong reduction in scope 2 market- based emissions reflects the Group’s strategy to increase the purchase of electricity from renewable sources certified by Guarantees of Origin (GO), with the aim of reaching 100% by 2030, thus bringing the value of scope 2 market-based emissions to zero.
The Group has set a target of zero scope 2 market-based emissions by 2030 by purchasing 100% green energy
Scope 3 emissions
The Group is indirectly responsible for emissions produced by its suppliers and customers and by the entire value chain. This is why it is committed to constantly refining the scope 3 emissions reporting scope.
Overall, in 2021, scope 3 emissions are up on 2020 due to the increase in total order by approximately 23%, also due to the expansion of the Group’s scope, and the refinement of calculation methodologies in the GHG inventory review.
| GHG emissions – Scope 3(tCO2eq) | 2021 | 2020 | 2019 |
|---|---|---|---|
|
Purchased goods and services1, 2 |
993,814 |
765,777 |
549,970 |
|
Capital goods (plants and machinery)1 |
7,190 |
3,256 |
38 |
|
Fuel- and energy-related activities not included in Scope 1 or 23 |
629,999 |
480,459 |
499,719 |
|
Upstream transport and distribution1.2 |
7,190 |
35,389 |
636 |
|
Waste generated in operations2,4 |
57,759 |
75,379 |
1,492 |
|
Business travel5 |
220 |
137 |
52 |
|
Employee commuting6 |
12,750 |
12,750 |
12,750 |
|
Use of products sold7 |
2,673,920 |
2,464,655 |
2,519,909 |
|
Downstream leased assets8 |
9,268 |
8,602 |
7,806 |
|
Investments2,9 |
205,715 |
241,472 |
41,400 |
|
Total |
4,697,799 |
4,087,876 |
3,633,772 |
1 All orders placed with suppliers during the year are analysed and emissions related to each type of goods, services and capital equipment purchased are estimated using the GHG Protocol’s Quantis Scope 3 Evaluator tool.
2 The data for 2020 has been restated.
3 Emissions are calculated using Well-to-Tank (WTT) UK Government GHG Conversion Factors for Company Reporting, which quantify emissions associated with the extraction, processing, and transportation of purchased fuels and electricity.
4 Emissions generated by the disposal of waste produced by the Group have been estimated, using emission factors from the Ecoinvent 3.7.1 database reprocessed using Simapro software.
5 Emissions from business travel are calculated through the Group’s travel agency (which handles all employee travel), which performs the environmental impact analysis. For the calculation of CO2eq emissions, all services booked through the travel agency portal (plane, train, rentals, hotel) are considered.
6 Estimated on the basis of the average number of employees (range of 5,000 to 10,000) using the GHG Protocol’s Quantis Scope 3 Evaluator tool.
7 Volumes of gas delivered to end customers multiplied by the emission factor related to the combustion of the gas are considered.
8 Calculated based on the value of rental and lease income earned using the GHG Protocol’s Quantis Scope 3 Evaluator tool.
9 Estimated for investee companies not consolidated on a line-by-line basis using the GHG Protocol’s Quantis Scope 3 Evaluator tool. The estimate is based on the annual revenues of the companies and the proportional share of Iren Group’s investment in each company.
The Business Plan targets include a 25% reduction in scope 3 emissions related to the use of sold products (category 11) and a 13% reduction in scope 3 emissions related to fuel- and energy-related activities not included in scope 1 or 2 emissions (category 3).
Emissions related to the use of sold products refer to those due to combustion, by the end user, of the natural gas distributed in the Group’s networks.
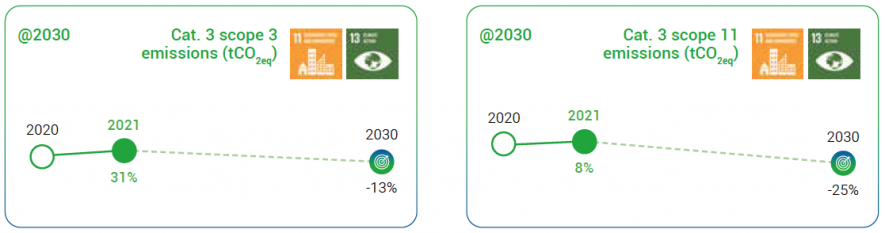
The reduction, foreseen by 2030, takes into account scenario analyses that consider aspects such as: the progressive electrification of consumption, the reduction in demand for natural gas for heating due to the rise in average temperatures, the market penetration of hydrogen and renewable gases. The item related to the purchase of fuels and electricity quantifies the emissions produced to extract, process and transport the fuels and electricity purchased by the Group. This type of emission is also expected to decrease as a result of both a reduction in the Group’s consumption, thanks to activities planned to minimise the power generation carbon intensity, and changes in emission factors.
Other atmospheric emissions from production plants concern sulphur oxides (SOX), nitrogen oxides (NOX), and particulates.
| Atmospheric emissions (t) | 2021 | 2020 | 2019 |
|---|---|---|---|
|
SOX1 |
43 |
63 |
25 |
|
NOX |
969 |
1,030 |
996 |
|
Polveri |
10 |
11 |
10 |
1 The data is calculated from the flue gas volume at the stack and the concentration measured by the emission analysis performed by an accredited external laboratory. The determined parameter, which describes the condition of a short period, is then extended to the whole year. This method of calculation may lead to significant differences from one year to the next.
Nearly 2.8 million tons of CO2eq avoided by eco-friendly energy production, sorted waste collection, material recovery and numerous other initiatives